The enhanced provider specific file for PDPM released by CMS has given us an unusual opportunity to study and understand things going on in our industry in a much more timely manner than we’re accustomed to. Let’s hope this trend continues.
In this post we’re going to be looking at the new functional scoring technique using Section GG. Using the per-facility breakdown of the new categories, we can estimate the underlying Section GG data driving the category. I say estimate because for each category we only know the range of the functional score. It’s not perfect but it’s more than we’ve had in the past with ADL scores.
As a refresher, here are the groups for PT and OT for a given Clinical Category and Functional Score. (Note: PT and OT were technically split with PDPM but they share a group.)
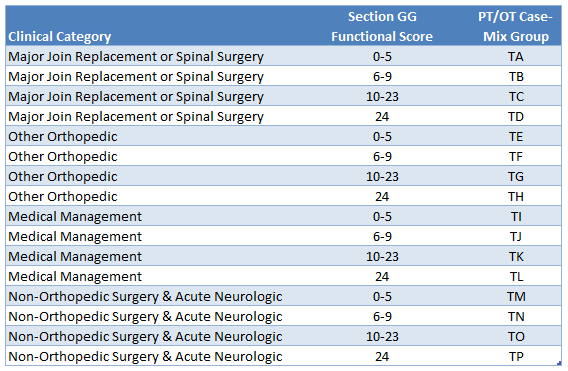
For our estimate here will use the average of the bounds. So if you have ‘TF’ as a group then we’ll assume the Functional Score is 7.5. We calculated the average functional score for each case-mix group and then multiplied that by the CMS-provided percentage for that group for every facility in the US. Then we average that by county and state.
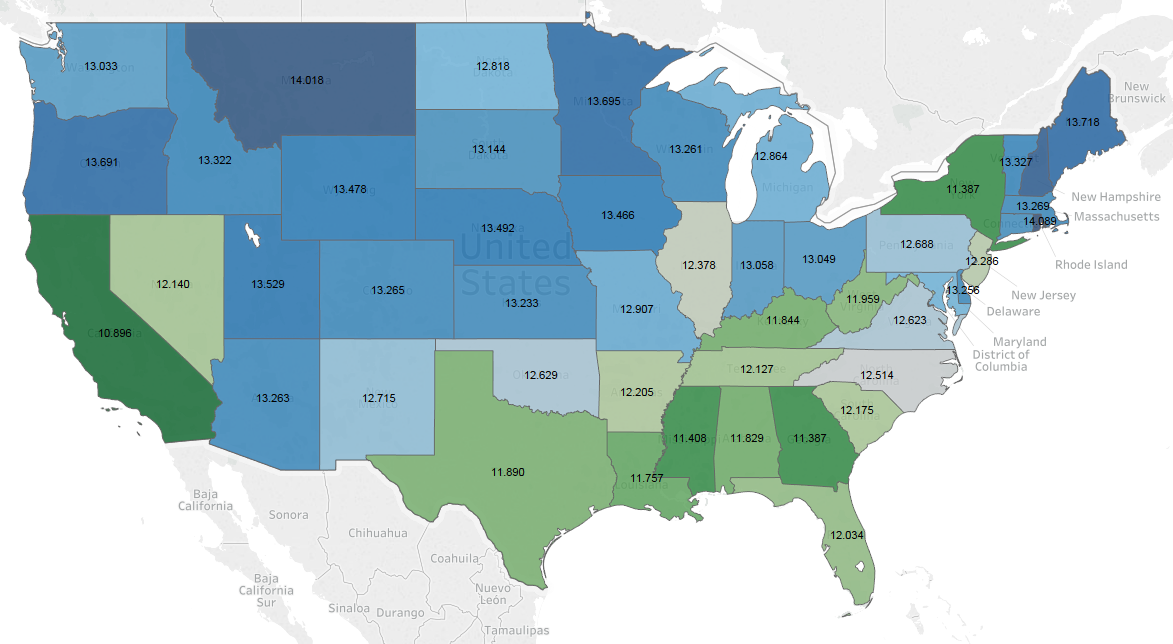
You can see the lowest functional scores are mostly in the southeastern US, the Appalachians, New York, California and Nevada. (Remember: lower functional scores mean lower functioning. It’s the opposite of ADL scores.)
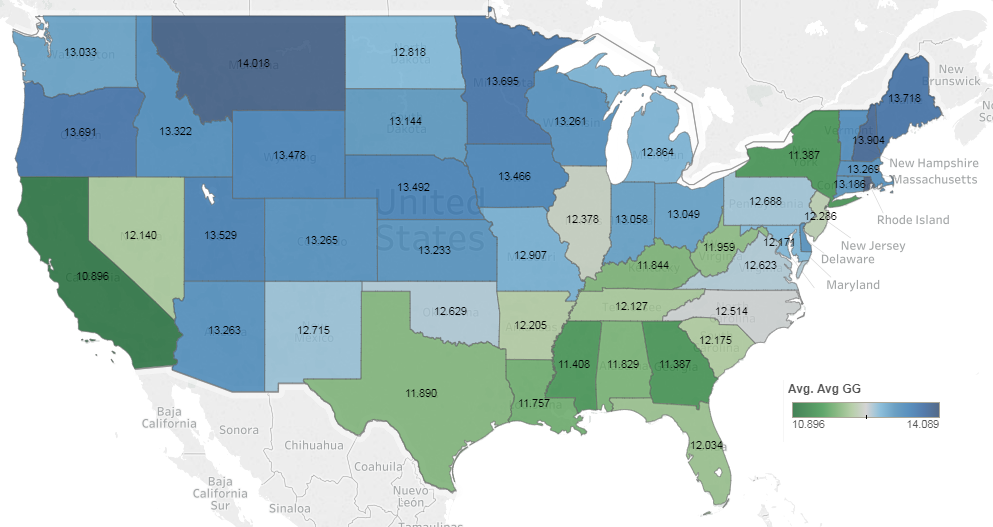
It’s interesting to note that higher functional scores will result in higher reimbursement for PT and OT under PDPM. That means the states in green will see lower reimbursement for PT and OT, all other things held constant.
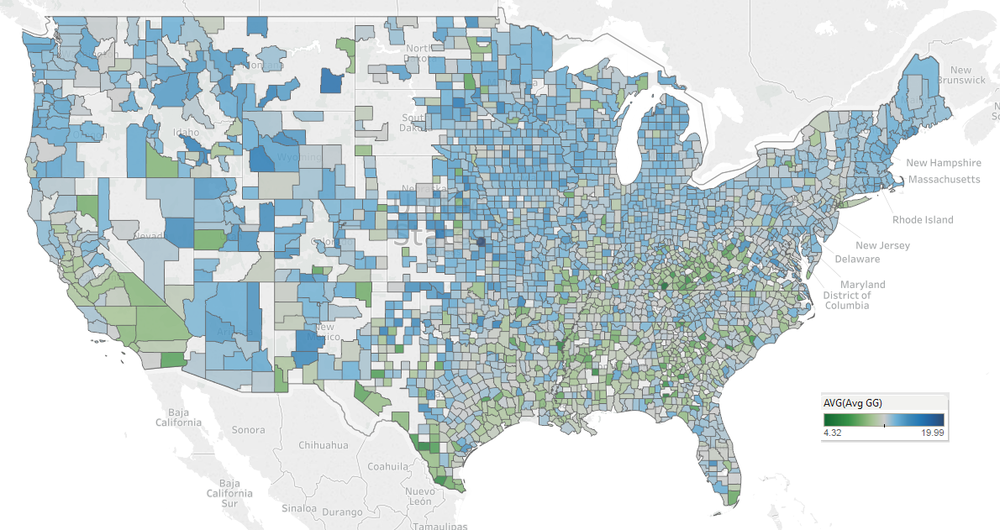
Here is the same data by county. You can see a few counties can really drive the state average. (Hats off to Wayne County, Ky with an average functional score of 4.316 (lowest) and Wabaunsee County, KS with an average functional score of 19.99 (highest).)