In today’s posting I am going to explain how to use Staffing Navigator™ to diagnose and troubleshoot a staffing issue that is causing problems in a 5 Star Rating. This post will also explain staffing cut points which can be confusing.
If you haven’t already, download Staffing Navigator™. It’s free in the app stores.
Hypothetical Problem Statement
Let’s say we work with a facility that bounces between 4 and 5 stars on Nursing Home Compare. It’s become a problem for one reason: This is a facility that markets itself on being 5 stars. They can’t have the rating occasionally slipping to 4 stars.
This is what most of us would consider to be a nice problem to have but it’s still a problem to solve. Let’s use Staffing Navigator™ to troubleshoot.
First, we select the facility from the list and check out the current situation. Right away we can see a few things:
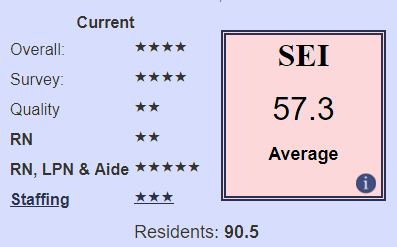
Figure 1
-
The survey is quite good at 4 stars. Getting that survey to 5 stars would be one way to solve the problem.
-
Neither Quality nor Staffing are high enough to get an extra star, but staffing might be close. We’ll need to investigate further.
-
This building has average size and acuity, so changing the staffing rating should be reasonable to do. (I’m basing this on the SEI. See the app for details.)
(If you aren’t familiar with the rules, touch the word “Staffing” for documentation that includes the rules and a handy table showing how RN and overall ratings translate into staffing stars.)
For the sake of our example, let’s say the facility recently had a survey that is going to be with us for a while. So while improving the survey rating is the most important thing to do, it isn’t the most expedient.
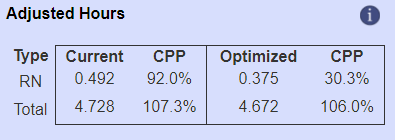
Figure 2
Next, scroll down to the Adjusted Hours section. I find this part of the app is the most confusing for people so let’s spend a little time here.
The hours you report on your PBJ are not used directly to determine your staffing ratings. The hours are first adjusted based on the acuity of your residents and the national average number of nursing hours. After those adjustments are made, then the cut points are applied and you see a rating. That’s why your adjusted hours don’t match reported hours. Adjusted hours, not reported hours, drive ratings.
Second, we need to understand CPP. CPP is telling us our position between the cut points. If CPP is 99%, that means you are right on the cusp of the next higher staffing rating. Likewise, a CPP of 1% means you are on the edge of moving down a rating. A CPP means of 50% you are exactly between cut points.
This is important because even when your PBJ doesn’t change at all, the number or residents in your building and their acuity does. Remember we use adjusted hours not reported hours. If your CPP is either very low or very high you will find staffing ratings bouncing around from quarter to quarter.
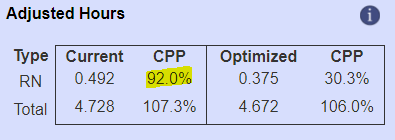
Figure 3
Let’s take a look at our adjusted hours again. I’ve highlighted the RN CPP of 92.0%. This means we are very close to the next higher rating for RNs.
If we take a look at the star rating table, we can see that we’re currently at an RN staffing rating of 2. Given our CPP of 92%, we would occasionally expect to drift into an RN rating of 3, which would give us 4 overall staffing stars and trigger an additional overall star. (Again, see the rules below the table in Figure 4 in the app.) We’ve identified a possible cause of the problem.
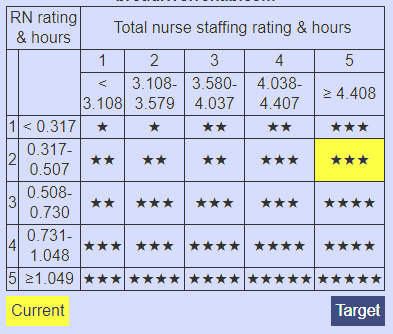
Figure 4
Now that we understand what’s happening, we can start to make some recommendations. The first thing we want to do is select an RN target rating of 3. After we do that, we check the results.
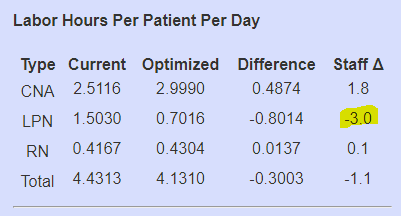
Figure 5
You can see in figure 5 that the optimizer is trying to reduce LPN hours to get to the least expensive way to get an RN rating of 3 and a total rating of 5. Since we’re just trying to work on RN hours, this isn’t really what we want. We want the optimizer to leave the LPNs and CNAs alone and let us focus on the RNs.
To do this, touch the “Minimum Hours” button at the bottom of the app and then touch the “Use Current” button and then touch “Back to Detail”. This tells the optimizer “Don’t make any changes unless I change a target.”
Back at the detail, we can see that’s exactly what’s happened. (See Figure 6.) The optimizer is telling us we need to add 10% of a full time RN to all shifts to get to 3 RN stars. But we aren’t quite done.

Figure 6
Looking at the adjusted hours, notice that the CPP is 0.0%. If we’re trying to protect against fluctuations in acuity and caseload, this isn’t going to help. We need to push away from the cut points.
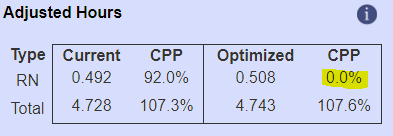
Figure 7
Fortunately, this is easy to do. We need to tell the optimizer we want more margin. Touch the “Minimum Hours” button and check the “CPP Target”. It’s set to 0% which means the optimizer will stop exactly when it hits the cut point. This isn’t what we want. In this case we want plenty of margin so we’ll choose 50%. That would place us exactly between the cut points.
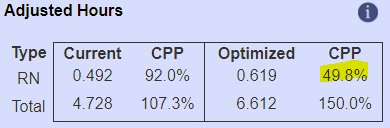
Figure 8
Notice in Figure 8 that we now have an optimized CPP of 49.8%. That’s plenty of margin. (Also notice that the CPP target of 50% caused the overall hours to be increased as well. If we want 50% margin for RN, it doesn’t make sense to keep the CPP for total nursing hours at 7.6% so both are increased.)
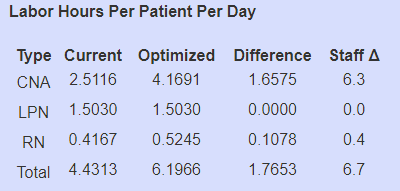
Figure 9
Here are the final optimized hours. (Figure 9) We now safely have a 3 RN rating and a 5 total rating which gives us 4 staffing stars. (Is this the cheapest way to get a 4 star staffing rating? Let’s call that homework. Staffing Navigator™ can easily do that too.)
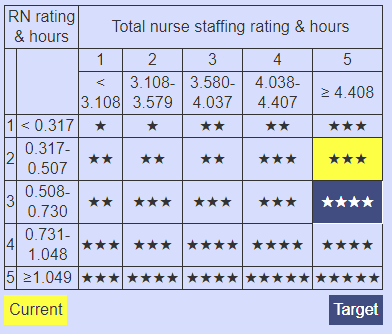
Figure 10
If you’d like additional help with Staffing Navigator™, or quality measures, or rehab obviously, then contact us!