We’re getting a lot of inquiries about 5 star ratings. It’s understandable because of the changes coming in April. One question we’re getting asked is “What would it take to improve my staffing rating?” or “How can I get another star?”
In this post we’re going to take a look at that, using the new staffing cut points and the latest data from the nursing home compare data. If you are unfamiliar with how those work or the April update, check out this post.
As our example, let’s assume you own a nursing home and your star ratings look like this:
| Category | Rating |
|---|---|
| Survey |  |
| Quality | |
| Staffing |
|
| RN Staffing | |
| Overall | |
Note: This is an actual facility I have chosen as an illustration. I have no affiliation with this building which I will keep anonymous. The data is real.
As you can see, overall this facility is 3 stars. It received one bonus star due to excellent quality metrics but did not get an extra star from staffing. (4 overall staffing stars would give another bonus star in this case.) So a natural question would be: How many more nurses would it take to generate that bonus star and get this building to 4 overall stars? (We’re ignoring the elephant in the room regarding survey scores.)
The Details
To answer our question we need to know a few things. First off we need to know that stars are assigned based on adjusted hours using the following table:
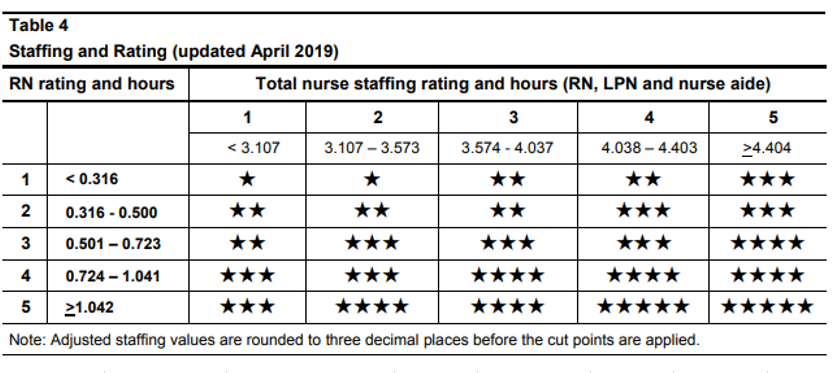
Cut Points as of April 2019 (click to enlarge)
Next we need to know is where we stand. Our example facility has a adjusted RN hours of 0.574 and overall adjusted nursing hours of 3.467. Looking that up in the table, you can see we have 3 RN stars and 2 total nursing which nets 3 stars for staffing.
Now we need to understand how adjusted hours are calculated.

Adjusted hours are simply scaled by the national average hours and the expected hours. (More on both of those later.)
Looking back at the table, there are several ways we can get 4 overall stars. We can keep RN stars at 3 and get overall nursing hours way up. We could run RN hours way up and keep overall nursing hours the same, or even lower. Or we could shoot for 4 RN stars and 4 total nursing stars. That seems like the logical choice: we’ll have more margin when any type of nursing hours fluctuate. (Keep in mind that case-mix hours are moving as well.)
So we now have an objective: raise the adjusted RN hours to ≥ 0.724 AND raise the overall adjusted nursing hours to ≥ 4.038.
Let’s add some additional requirements:
-
Aide, LPN and RN hours should at least meet or exceed the case-mix hours. (These used to be called expected hours so you can see why we’d like to get as close to those as possible.)
-
Minimize the cost. Cost is the reason there aren’t more nurses in facilities anyway so we might as well optimize to get the maximum 5 star rating we can get for our dollar.
For our example facility I am assuming that the hourly costs per nurse type are as follows. Keep in mind that the exact numbers don’t matter much, just the relationship. (Aide hours cost less than LPN hours which cost less than RN hours.)
| Nurse | Hourly Rate |
|---|---|
| Aide | $15.00 |
| LPN | $22.50 |
| RN | $31.25 |
The Disclosure
To solve this problem I am going to use a technique called linear programming. I’m not going through all the details here because that’s not the point of this post.
The Results
| Nurse | Original Hours | Optimized Hours | FTE Change | Daily |
|---|---|---|---|---|
| Aide | 2.09315 | 2.6721 | +3.9 | $1,390.33 |
| LPN | 1.10166 | 0.9270 | -1.2 | $(629.21) |
| RN | 1.2568 | 1.5861 | +2.2 | $1,647.62 |
| Total | $2,408.74 | |||
You can see in an attempt to minimize the expense, the optimization reduced the number of LPNs and increased CNAs, because under the star rating system, LPNs and CNAs are the same. (Obviously that’s not true in the facility, just the star ratings.)
Okay, at first glance you’re probably thinking: “$2,408.74 per day?!” The short answer is “yes”. It costs a lot to increase staffing. It’s also the future with PDPM. Check out this article.
Why so much?
One thing I said I would come back to is the “case-mix hours”. Remember this equation?
The case-mix hours in the denominator represent the acuity of the patients in your facility. In fact, those hours are useful to compare one facility to any other in the country. You can’t know exactly what RUGs were billed but you can be sure that higher case-mix hours mean more nursing hours are expected. (Acuity, in this case, is based on the STRIVE Study which maps nursing hours to the RUGS IV 66 grouper. It’s actually pretty interesting and a little controversial. Maybe that’s a topic for another time.)
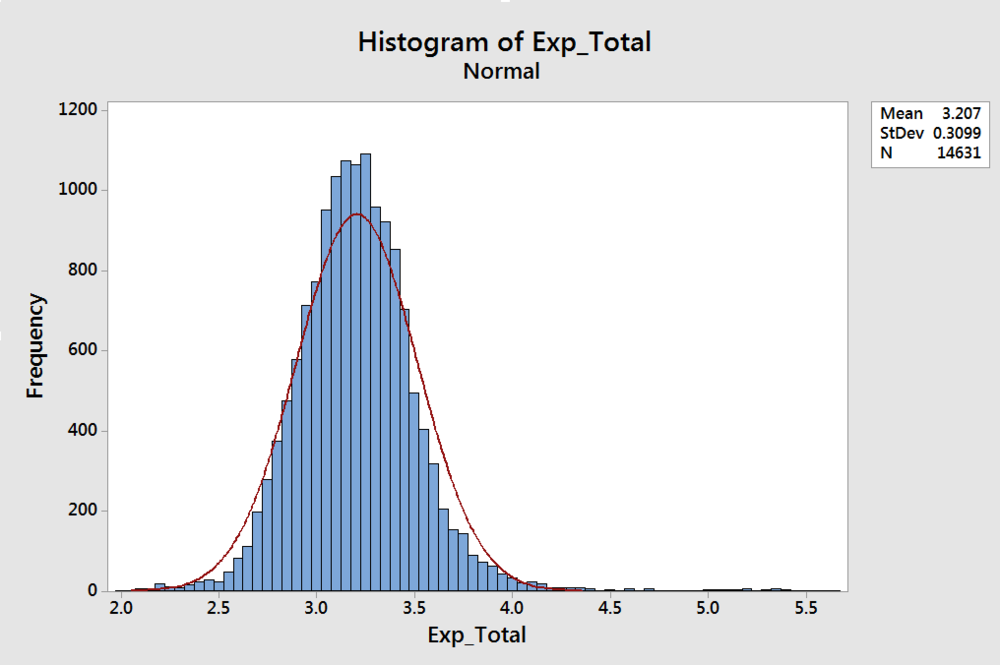
Case-mix hours or “expected” number of total nursing hours per day for all skilled nursing facilities
This is a histogram of the expected overall nursing hours for every facility in the US. Notice the tight distribution.
One thing I didn’t share earlier about our example facility is the overall case-mix hours are 4.12158. Take a moment to find 4.12 on that histogram. Our example facility is in the 99th percentile for case-mix, or expected hours. (That means our example facility has higher acuity that 99.1% of the facilities in the US.)
If you refer to the equation from earlier, you can see that higher case-mix hours lower your adjusted hours, meaning you need more hours for a given star rating if you have higher average acuity. This is important. Read the part in bold again. Acuity is a moving target and changes each time new star ratings are released, but if your building has a tendency to trend higher, you’ll pay for it in either a lower star rating or higher labor costs.
How much higher? In this case, if our example facility were in the 50th percentile for acuity instead of the 99th, it would become a 5 star staffing facility immediately. In fact they could actually have fewer RNs and LPNs on average (with slightly more CNAs) and still be five stars for staffing. The bottom line is that if this facility were in the 50th percentile, they could potentially save $3,016.93 per day in labor! That’s a $5,425.67 daily difference from our optimized plan to get 4 stars.
Taken further, if this facility were in the 1st percentile instead of the 99th, the potential labor savings would be $5,371.08 per day or $1.96M annually.
While you can’t just change acuity, do keep in mind the effect it is having on your star rating.
Final Thoughts
One more thing I didn’t mention is your adjusted hours are also affected by the national average numbers. That means that if the national averages were to rise for some reason, like say, PDPM, then your adjusted hours would go up without you making any changes. Don’t say CMS never gave you anything.
Contact us today if you would like to analyze your staffing star ratings.