The Pepper reports give us a glimpse into trends in Medicaid Part A in skilled nursing facilities. Sometimes you have to do a little summarizing yourself to figure out what you want to know. What I wanted to know was “Which states report the highest ADL scores?” Pepper had the data but it needed a little TLC.
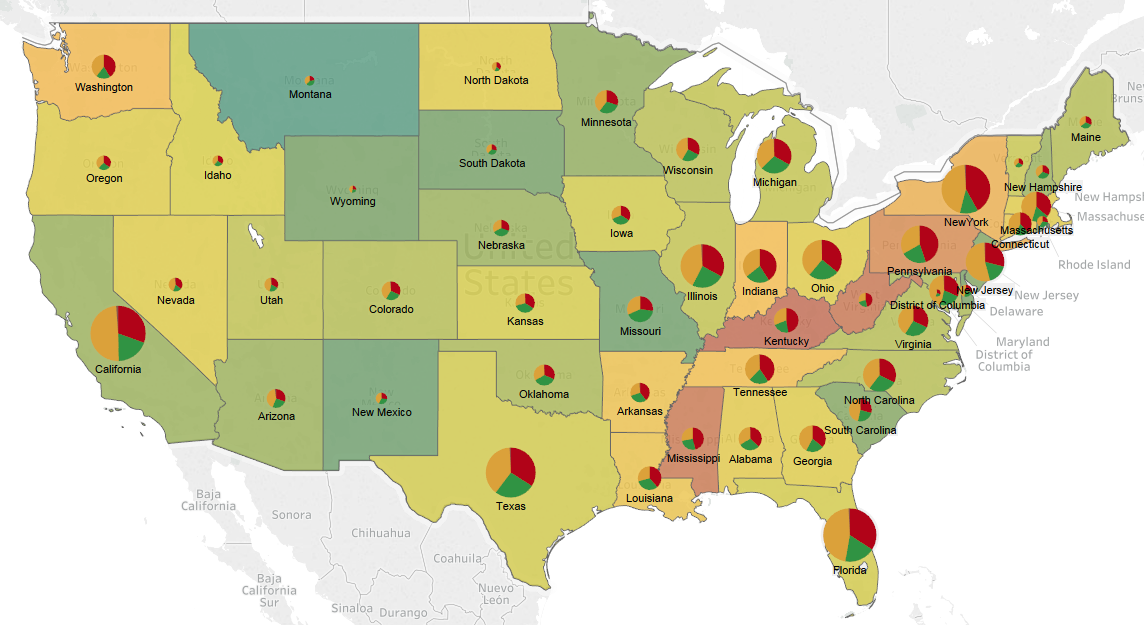
As you can see in the map below (ht Tableau), there is a lot of variation nationwide on ADL scoring. The states with the highest percentage of Medicare Part A patients with high ADL scores follow a path up the Mississippi river and into the northeastern US. The pattern is similar to the “Stroke Belt” data published by the Heart Attack and Stroke Prevention Center.
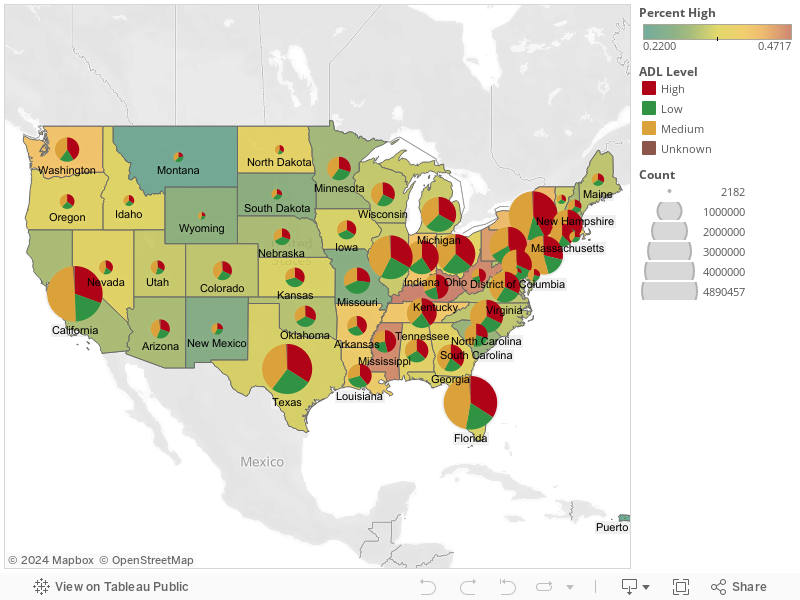
I added pie chart for each state so you could see the proportion of high (ADL score 11-16), medium (6-10) and low (0-5). The pie charts are sized based on the number of Part A days.